<html>
<head>
<title>D3.js</title>
</head>
<body>
<script src="http://d3js.org/d3.v3.min.js" charset="utf-8"></script>
<script type="text/javascript">
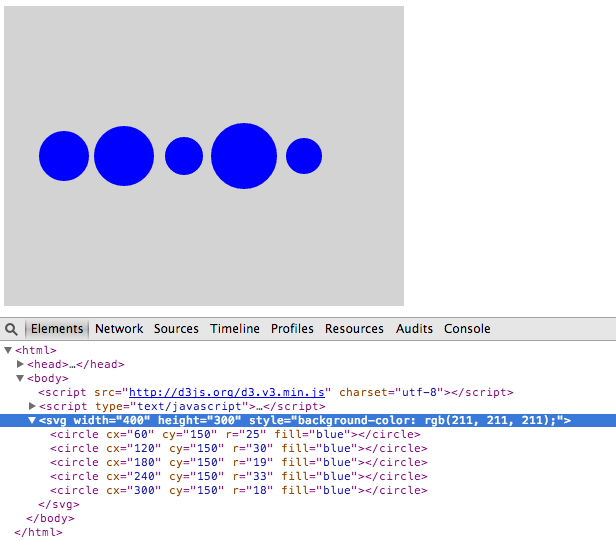
var dataset = [25, 30, 19, 33, 18];
var h = 300;
var w = 400;
var svg = d3.select("body")
.append("svg")
.attr({width:w, height:h})
.style("background-color","lightgray");
svg.selectAll("circle")
.data(dataset)
.enter()
.append("circle")
.attr({
cx: function(d,i){return (60 + (i * 60));},
cy: h/2,
r: function(d,i){return d;},
fill:"blue"
});
</script>
</body>
</html>